How can I plot WhiteboxRaster objects?
While there exists a built-in plot method for all
WhiteboxRaster and WhiteboxVector objects, it
is highly advisable to use {terra}’s
plotting functionality by converting the Whitebox...
objects to SpatRaster or SpatVector
accordingly as follows:
library(wbw)
library(terra)

f <- system.file("extdata/dem.tif", package = "wbw")

wbw_read_raster(f) |>
  wbw_multidirectional_hillshade() |>
  as_rast() |>
  plot(legend = FALSE)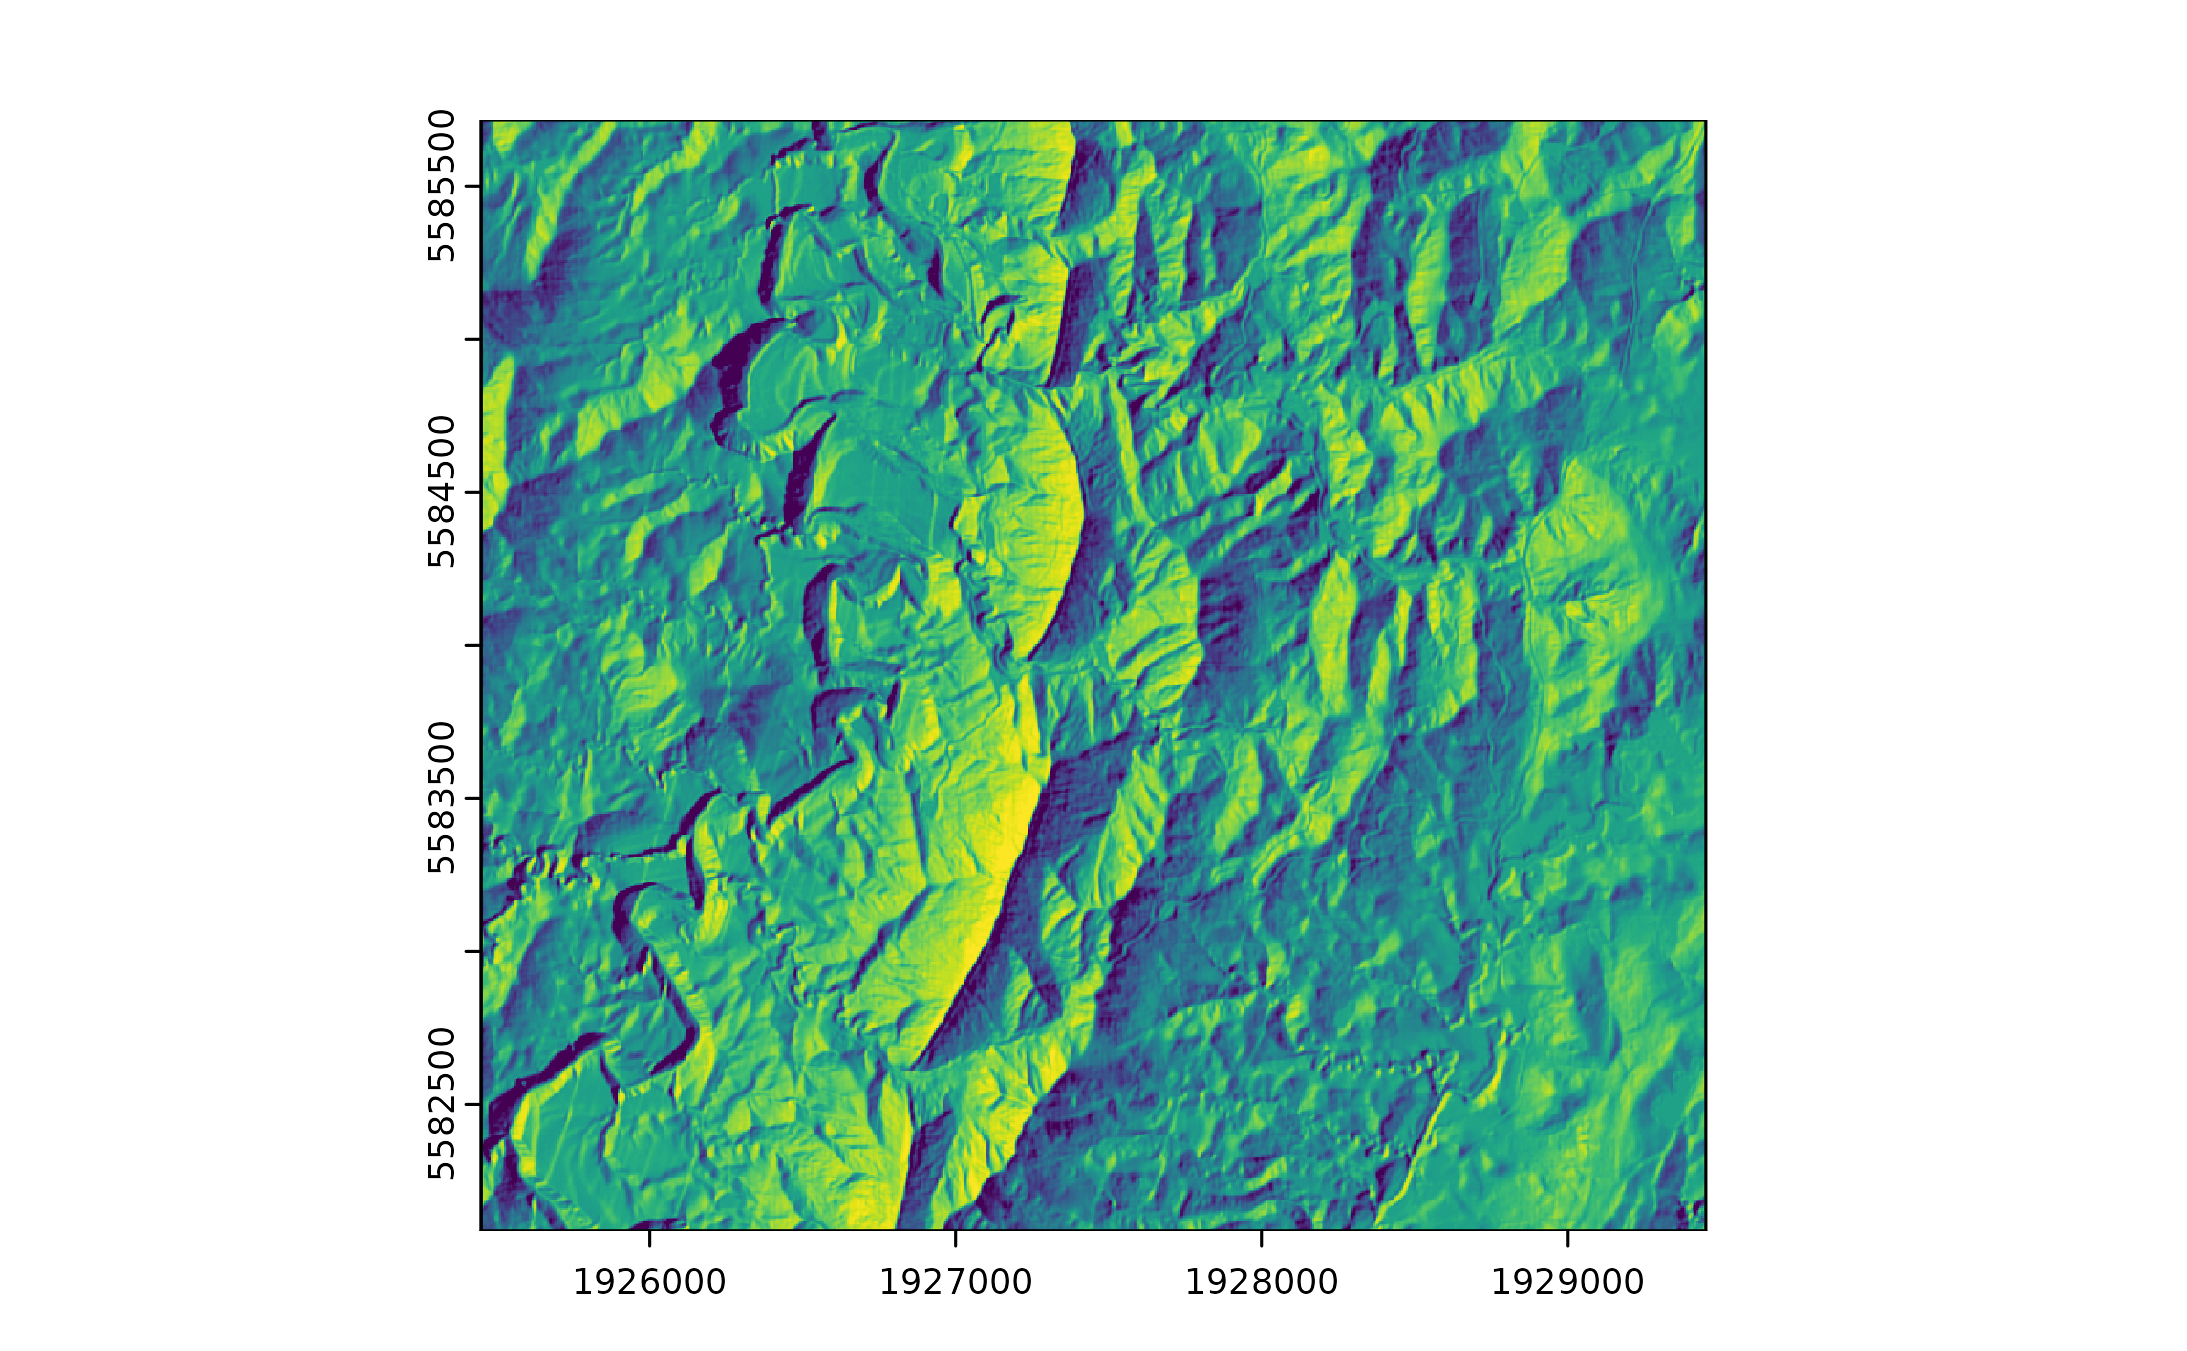
I’ve noticed that raster extent differs between WhiteboxRaster and terra/GDAL
Yes, that’s true! Since the original Python library Whitebox Workflows for Python is closed-source, the reason for this behavior is unknown. One possible explanation (i.e., my guess) is that GDAL typically defines the extent based on the outer edges of the corner pixels, while WbW may define the extent based on the centers of the corner pixels.
library(wbw)
library(terra)

f <- system.file("extdata/dem.tif", package = "wbw")

wbw_raster <- wbw_read_raster(f)
terra_raster <- rast(f)

# Compare extents
# Mind the difference in xmax (east) and ymin (south)
waldo::compare(
  as_vector(wbw_ext(wbw_raster)),
  as.vector(ext(terra_raster))
)
#> `names(old)`: "west" "east" "south" "north"
#> `names(new)`: "xmin" "xmax" "ymin"  "ymax"
#>
#> `old`: 1925449.3 1929446.2 5582091.5 5585716.6
#> `new`: 1925449.3 1929451.2 5582086.5 5585716.6
However, this issue is fixed when transitioning from
WhiteboxRaster to SpatRaster via the
as_rast() command: